How much does a hydro turbine cost? Rebuilding our cost model from 156 real plants
Alberto Santolin··9 min read
We have released a new version of the HPP-Design cost model. Every Pelton, Francis and Kaplan sizing now shows a cost range for the turbine-generator set, based on seven published sources, 156 real plants up to 2 MW and the contract costs of 81 larger projects.
This version is a regular revision of the model, built on a new calculation core. Further revisions will follow as new cost data become available.
The previous version was based on a correlation published in 2016 in Energy, which I co-authored (Cavazzini et al., 2016). That correlation works well within the range of the plants used to build it, up to about 1.5 MW. To cover larger machines we needed data from other sources.
We went back to the literature, collected the cost correlations we could verify and tested them against real plants.
What the estimate includes
The estimate covers the turbine-generator set at ex-works price: what a manufacturer would quote for the machine leaving the factory. Defining this scope was the first step, because published "costs" mean very different things.
| Included | Not included |
|---|---|
| Turbine (runner, casing, distributor or nozzles) | Transport and installation on site |
| Inlet valve (not on Kaplan units) | Control system, switchgear, transformer |
| Governor and regulation elements | Civil works, penstock, powerhouse |
| Generator (alternator) | Grid connection, engineering, permits |
The estimate refers to one turbine-generator unit. If your project has two units, size each one and add them up. Prices are in euros of the current year: every quarter they are re-indexed with the latest Eurostat producer price index for engines and turbines, so the estimate follows market prices.
The index is European, but we apply it to every project, wherever it is. Turbines and generators are sold on an international market, and the price trend measured in Europe is a reasonable proxy for the trend elsewhere. The contract data we used for large units point the same way: across 81 projects in 32 countries, units in Europe and Turkey cost about the same as units of the same size and head in Asia, Africa and Latin America (within 10%, not a significant difference). Outside Europe the estimate is therefore a sound first reference. Local manufacturers can be cheaper, and transport and import duties come on top.
In the sources we reviewed, the same plant can be priced as "turbine only", "turbine + generator", "complete electromechanical package" or "total installed cost". Between the first and the last there is easily a factor of 3, and this is the most common reason why published cost estimates disagree.
How we built the new model
We coded seven cost correlations from the literature, brought them to the same scope and price year, and checked each one against real plants before using it.
- Collect and verify. Every formula was checked by reproducing the tables of its own paper.
- Harmonise. Each source was converted to the same scope (turbine-generator, ex-works) and to current euros. Currencies were converted at the source's price year using ECB rates, then escalated with the Eurostat producer price index for engines and turbines (NACE C28.11), the same index for every source, European or not.
- Validate. We assembled 156 real plants from the published datasets, after removing duplicates: 52 Pelton, 59 Francis, 45 Kaplan. Every candidate formula was scored on how far it lands from their actual cost. Above 2 MW we used the contract costs per unit of 81 projects in 32 countries (Alvarado-Ancieta, 2009).
- Combine. None of the sources covers the whole range from 10 kW to several hundred MW, so the final model uses the best-performing source in each power range, with a smooth transition between them.
The model uses four sources, each in its own power range:
| Power per unit | Source | Data behind it |
|---|---|---|
| Up to ~1 MW | Cavazzini et al. 2016 (Pelton, Francis); Ogayar & Vidal 2009 (Kaplan) | Real plants in Italy, Spain and Latin America |
| 1–10 MW | Smooth transition through the NVE 2010 cost curves, scaled to Southern European price levels | Norwegian plants built 2005–2010 |
| 10 MW and above (up to 170 MW Pelton, 700 MW Francis, 125 MW Kaplan) | Alvarado-Ancieta 2009, contract costs per unit | 81 projects in 32 countries, contracts 2002–2008 |
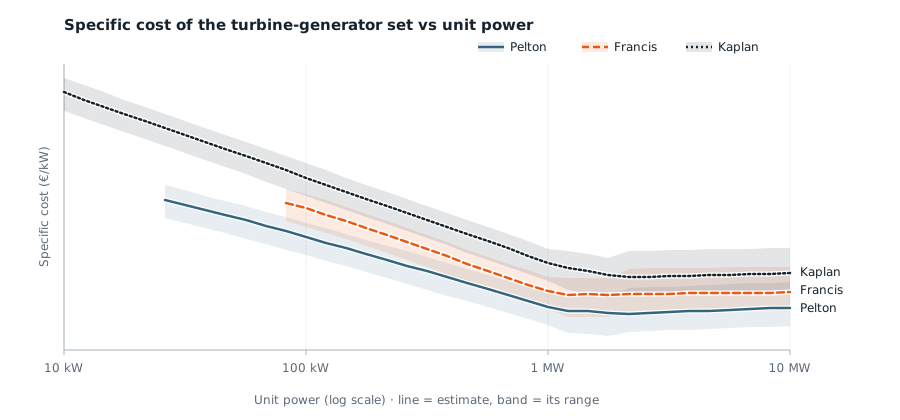
Few published data cover units above 2 MW. Almost every correlation is built either on small plants (below 2 MW) or on large ones (above 5–10 MW), and outside their range the former tend to underestimate the cost and the latter to overestimate it. Around 2 MW we start from the cost curves of the Norwegian Water Resources and Energy Directorate (NVE), based on projects actually built. Norway is more expensive than Southern Europe, so we measured the ratio where both data sets overlap (0.5–1.5 MW) and applied it. Above 2 MW the estimate follows the contract costs per unit collected by Alvarado-Ancieta (2009), from 2 MW to 700 MW per unit, converted to the turbine-generator scope. The 45 plants behind the AlZohbi (2018) correlation turned out to be the same projects, so we counted them once.
What changes in your sizing report
Every estimate now comes with a range, a confidence label and the source it is based on.
- Cost range. Within the calibrated range the band is ±25%, which contains about 80% of the real plants we tested. In the transition zones it widens to ±30%. Above 2 MW it is asymmetric (−25% / +50%), because the contract costs of large units spread more upwards than downwards.
- Confidence label. Each estimate says whether it is calibrated (inside the data), blended (between two sources) or extrapolated (outside all data, low confidence).
- Units out of range. Below the smallest plants in the data (about 25 kW for Pelton, 80 kW for Francis, 10 kW for Kaplan) no published correlation is reliable, so the report shows no cost. The same applies above the largest units in the data: 170 MW for Pelton, 700 MW for Francis and 125 MW for Kaplan.
- Kaplan configuration. A double-regulated (full) Kaplan costs about 1.6–1.7 times a semi-Kaplan of the same size, according to the Ogayar & Vidal data. Fixed-blade propeller units are estimated at 0.9 times a semi-Kaplan: that factor is our engineering assumption and is labelled as such.
Each report shows the model version and the months of the price index it was calculated with.
Here is the card for one real sizing: a Francis unit with 120 m net head and 2 m³/s design flow at 50 Hz, about 2.1 MW.
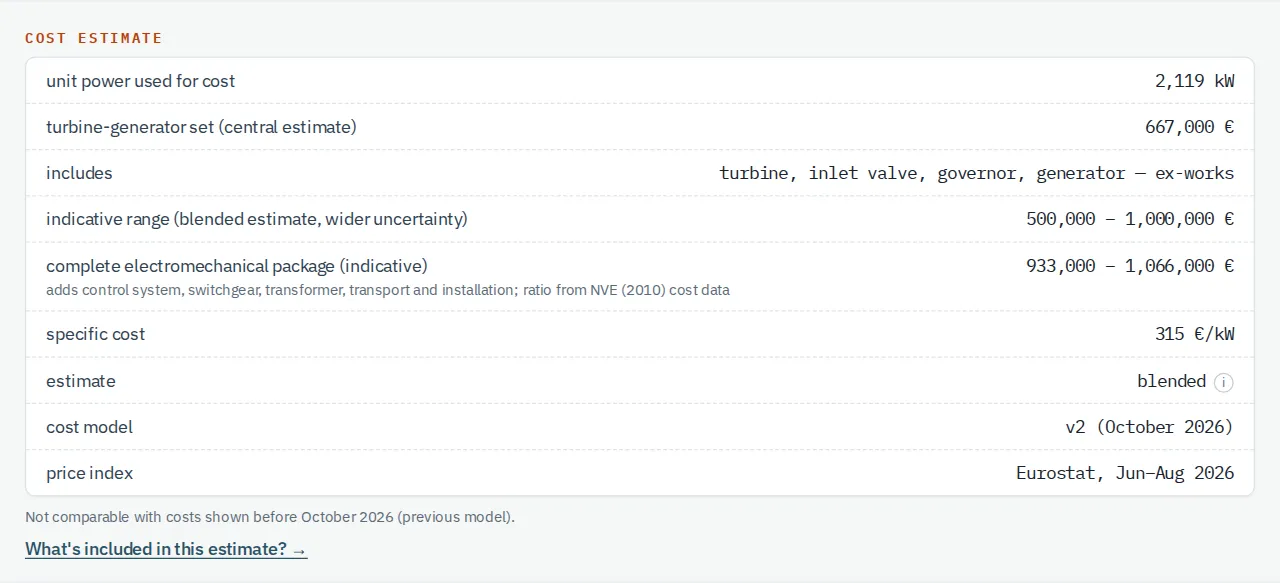
Read the central value together with its range and label: at 2.1 MW this unit sits between two data sources, so the estimate is blended and the range is wider and asymmetric. The package row is a budget indication for the complete electromechanical supply, derived from the turbine-generator set; it is not a quote.
Try the new estimate on your next sizing →
Five things we learned from the literature
- Check the scope before the number. Most disagreements between sources are not about the market: they are about what is included. Always ask "turbine only, turbine-generator, full package, or installed?"
- Know which machine the data describe. The Kaplan data behind several correlations come almost entirely from semi-Kaplan units. Applied to a double-regulated Kaplan, they underestimate the cost by about 40%.
- Be wary of cost per kW that grows with size. One recent correlation for large Pelton and Francis units has a cost per kW that increases with power. That runs against every other data set we found, and its scope is not declared. We did not use it.
- Never stretch a formula far outside its data. Small-plant correlations decline steeply with power; large-plant ones rise steeply at the low end. Between 2 and 10 MW they can differ by a factor of 5 or more, which is why above 2 MW we used contract costs per unit instead.
- Check that two data sets are really different. The 45 plants of a 2018 correlation are the projects of a 2009 contract survey, with rounded figures. Counted twice, they look like an independent confirmation.
How to use the estimate
The estimate is a pre-feasibility figure: good for comparing turbine types, screening sites and checking an order of magnitude. It does not replace a manufacturer's quotation.
- Use it to compare options. The relative cost of Pelton vs Francis, or full vs semi-Kaplan, is more reliable than the absolute value.
- Read the label. A calibrated estimate is backed by real plants of similar size; an extrapolated one is only a rough indication.
- Add what is not included. Transport, installation, control and electrical equipment typically add another 40–60% on top of the turbine-generator set (NVE data), before civil works.
- Ask for quotes on real projects. Prices vary with market conditions, materials and supplier workload.
Share your cost data and earn credits
We will keep improving the model as new data come in, for any turbine type and size. If you have an offer, a contract or a final cost for a turbine-generator set, you can share it with us: upload the document, or fill in the main figures if you prefer not to share it. Each validated contribution earns you free credits. Data are used only in aggregate and anonymised form, and never published individually. If we use them in a scientific publication, contributors who agree will be acknowledged by name. Data from outside Europe are especially welcome: they will tell us whether a regional factor is needed.
Try the new estimate on your next sizing →
References
- Cavazzini G., Santolin A., Pavesi G., Ardizzon G. (2016). Accurate estimation model for small and micro hydropower plants costs in hybrid energy systems modelling. Energy, 103, 746–757.
- Ogayar B., Vidal P.G. (2009). Cost determination of the electro-mechanical equipment of a small hydro-power plant. Renewable Energy, 34, 6–13.
- NVE (2010). Kostnadsgrunnlag for små vannkraftanlegg. Håndbok 2010-01, Norwegian Water Resources and Energy Directorate.
- Alvarado-Ancieta C.A. (2009). Estimating E&M powerhouse costs. International Water Power & Dam Construction, 61(2), 21–25.
- AlZohbi G. (2018). The cost of electromechanical equipment in a small hydro power storage plant. Journal of Energy Systems, 2(4), 238–259.
- Aggidis G.A., Luchinskaya E., Rothschild R., Howard D.C. (2010). The costs of small-scale hydro power production. Renewable Energy, 35, 2632–2638.
- Lipiński S., Olkowski T. (2017). Estimation of the cost of electro-mechanical equipment for small hydropower plants – review and comparison of methods. E3S Web of Conferences, 19, 01023.

Alberto Santolin
Founder of HPP-Design, PhD in turbomachinery; hydropower engineer since 2008.
LinkedIn profile